Assignment 3 - Persuasive Infographic
Written on November 12th, 2025 by Wan-Ting Chang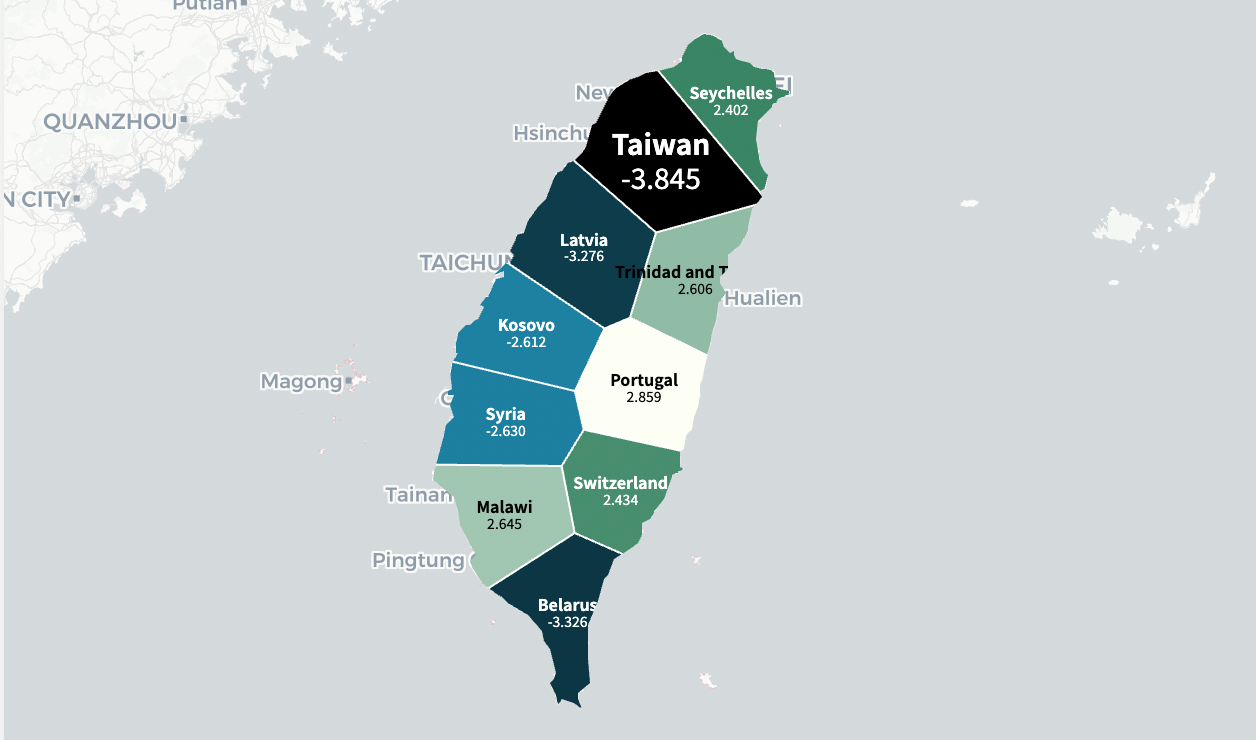
Project Title: China’s Attempts to Undermine Taiwan’s Security
1. Inspiration and Context
For this assignment, I drew inspiration from a concise infographic on misinformation from a previous student’s work shared by the professor. This immediately made me think of Taiwan. According to data from the Digital Society Project, Taiwan has been ranked #1 in the world for over a decade regarding the dissemination of false information by foreign governments.
While I was initially focusing on digital misinformation, the scope of the project expanded as new evidence came to light regarding physical security threats. To attract attention and highlight the severity of the situation, I used engaging phrasing throughout the infographic.
2. Visual Storytelling Components
Subsea Cable Incidents: Did you know Chinese ships have cut Taiwan’s global cables 30+ times since 2017? I visualized deliberate acts by vessels to sever Taiwan’s external communications, highlighting the vulnerability of Taiwan’s digital infrastructure.
Physical Military Provocations: Did you know China’s military has operated near Taiwan almost daily for the past five years? By mapping trajectories of PLA aircraft and vessels, I illustrated the relentless nature of these daily activities within Taiwan’s ADIZ.
Digital Misinformation: Did you know that Taiwan has been the country most influenced by foreign dissemination of false information for 11 years? Utilizing a treemap, I contextualized Taiwan’s position compared to other nations worldwide.
3. Technology Stack
To achieve these visualizations, I utilized a variety of technologies for data collection, processing, and rendering, inspired by examples provided in class:
Geospatial Visualization: I used OpenStreetMap combined with GeoJSON data to plot geographic locations and vessel paths for the cable cutting incidents.
Military Route Mapping: I developed a Python web crawler to gather daily report images from the Ministry of National Defense, R.O.C. To map the trajectories of PLA aircraft and vessels over time, I applied a Maximum Difference Projection technique to highlight daily movements.
Interactive Treemap: The misinformation data is displayed using a D3.js Treemap, enhanced by the d3-voronoi-treemap library to create custom, non-rectangular partitioning in the shape of Taiwan, allowing an emphasis for the views on Taiwan.
4. Conclusion
This project demonstrates that the attempts to undermine Taiwan’s security are faceted, combining an intense digital disinformation campaign with constant physical provocations. By structuring the data with engaging prompts and technical precision, this infographic provides a holistic view of the daily challenges to Taiwan’s security and stability.
Links
- Interactive Version: View the interactive infographic
- PDF Version: Download the infographic PDF