Assignment 4 - Data Story (Group)
Written on November 26th, 2025 by Wan-Ting Chang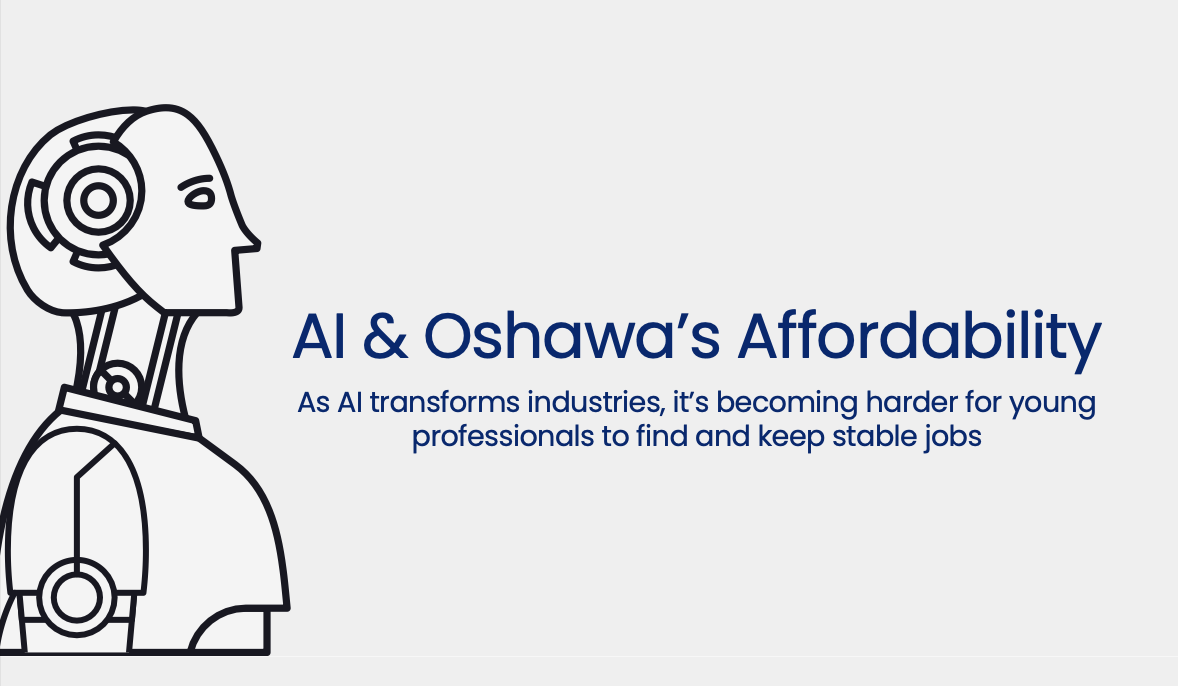
To What Extent Is AI Affecting Affordability For Young Professionals In Oshawa?
Agenda
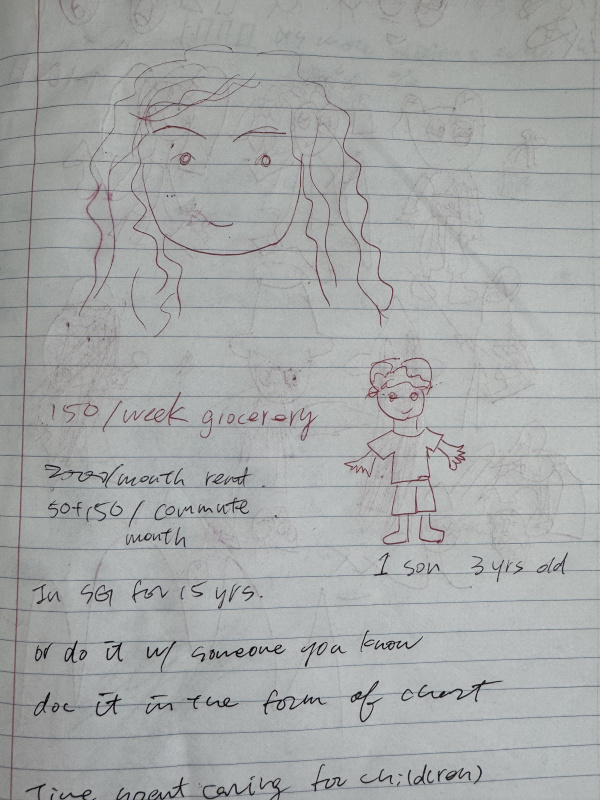
- Method and hand drawn sketch
- Dataset used
- Story flow
- Personas
- Tools and techniques used
- Color palette & font choice
Method Used
Scrolly Telling
Datasets Used
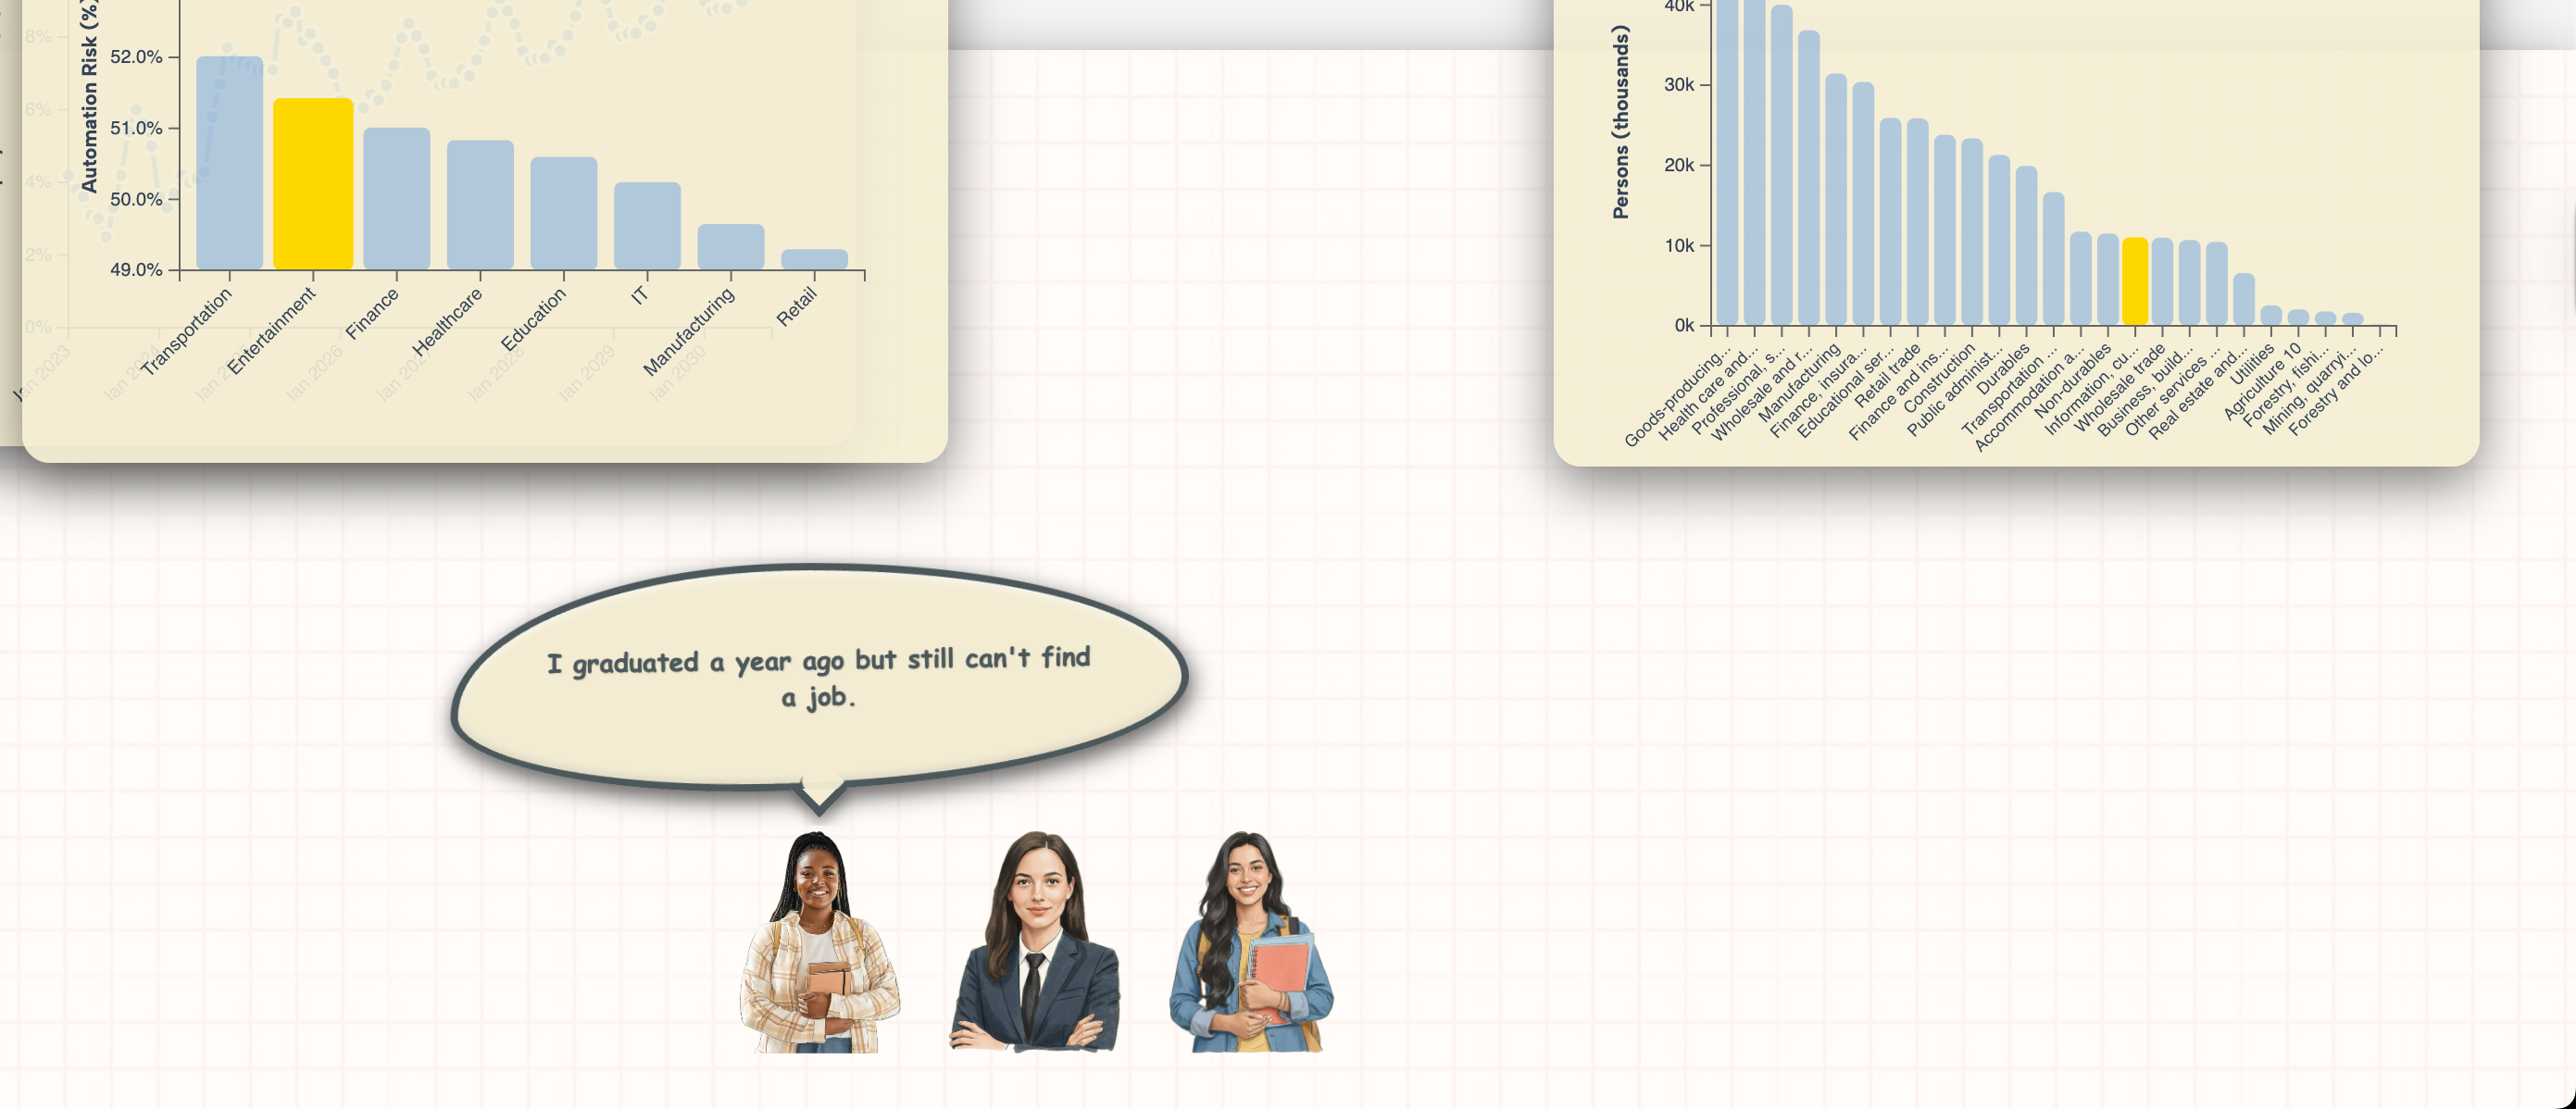
- Industries affected by AI in Canada - 2024 - 2030.
- The top eight industries affected by AI in Canada were selected. The job market for those industries in Oshawa in 2024 were examined, focusing on the 24-54 age group.
- Unemployment rate in Oshawa from 2022 to 2025 (age group 24 - 34) and forecasted it through 2030.
- Housing rents in Oshawa from 2023 to 2030 (data forecasted from 2026 to 2030 based on historical data (2017 to 2025)).
Graphs & Charts Used
[Charts and graphs would be displayed here]
Story Flow
| Intro | Problem Statement |
|---|---|
| Oshawa was affordable before AI | AI is reshaping job opportunities in Canada. Take the top five affected fields in CA to compare them in Ontario. Rent is increasing in Oshawa. Unemployment rate is increasing. |
| How many times job disruption, and where circumstances are leading it harder to live here | |
| Our take on solution | Storytelling |
| Industry affected by AI in Canada (Chart (all industries)) | No of People in each industry (Chart (596) (highlight the person’s industry). |
| AVIDNAGE of Automation Risk (To) vs. Industry | 20% (2010) |
Persona Development
- Industry
- Working? Yes, No
- Affect of AI on their job positions
Tools & Techniques Used
[Tools and techniques would be listed here]
Visual Elements
Font: Poppins