Assignment 1 - Storyboard
Written on October 5th, 2025 by Wan-Ting Chang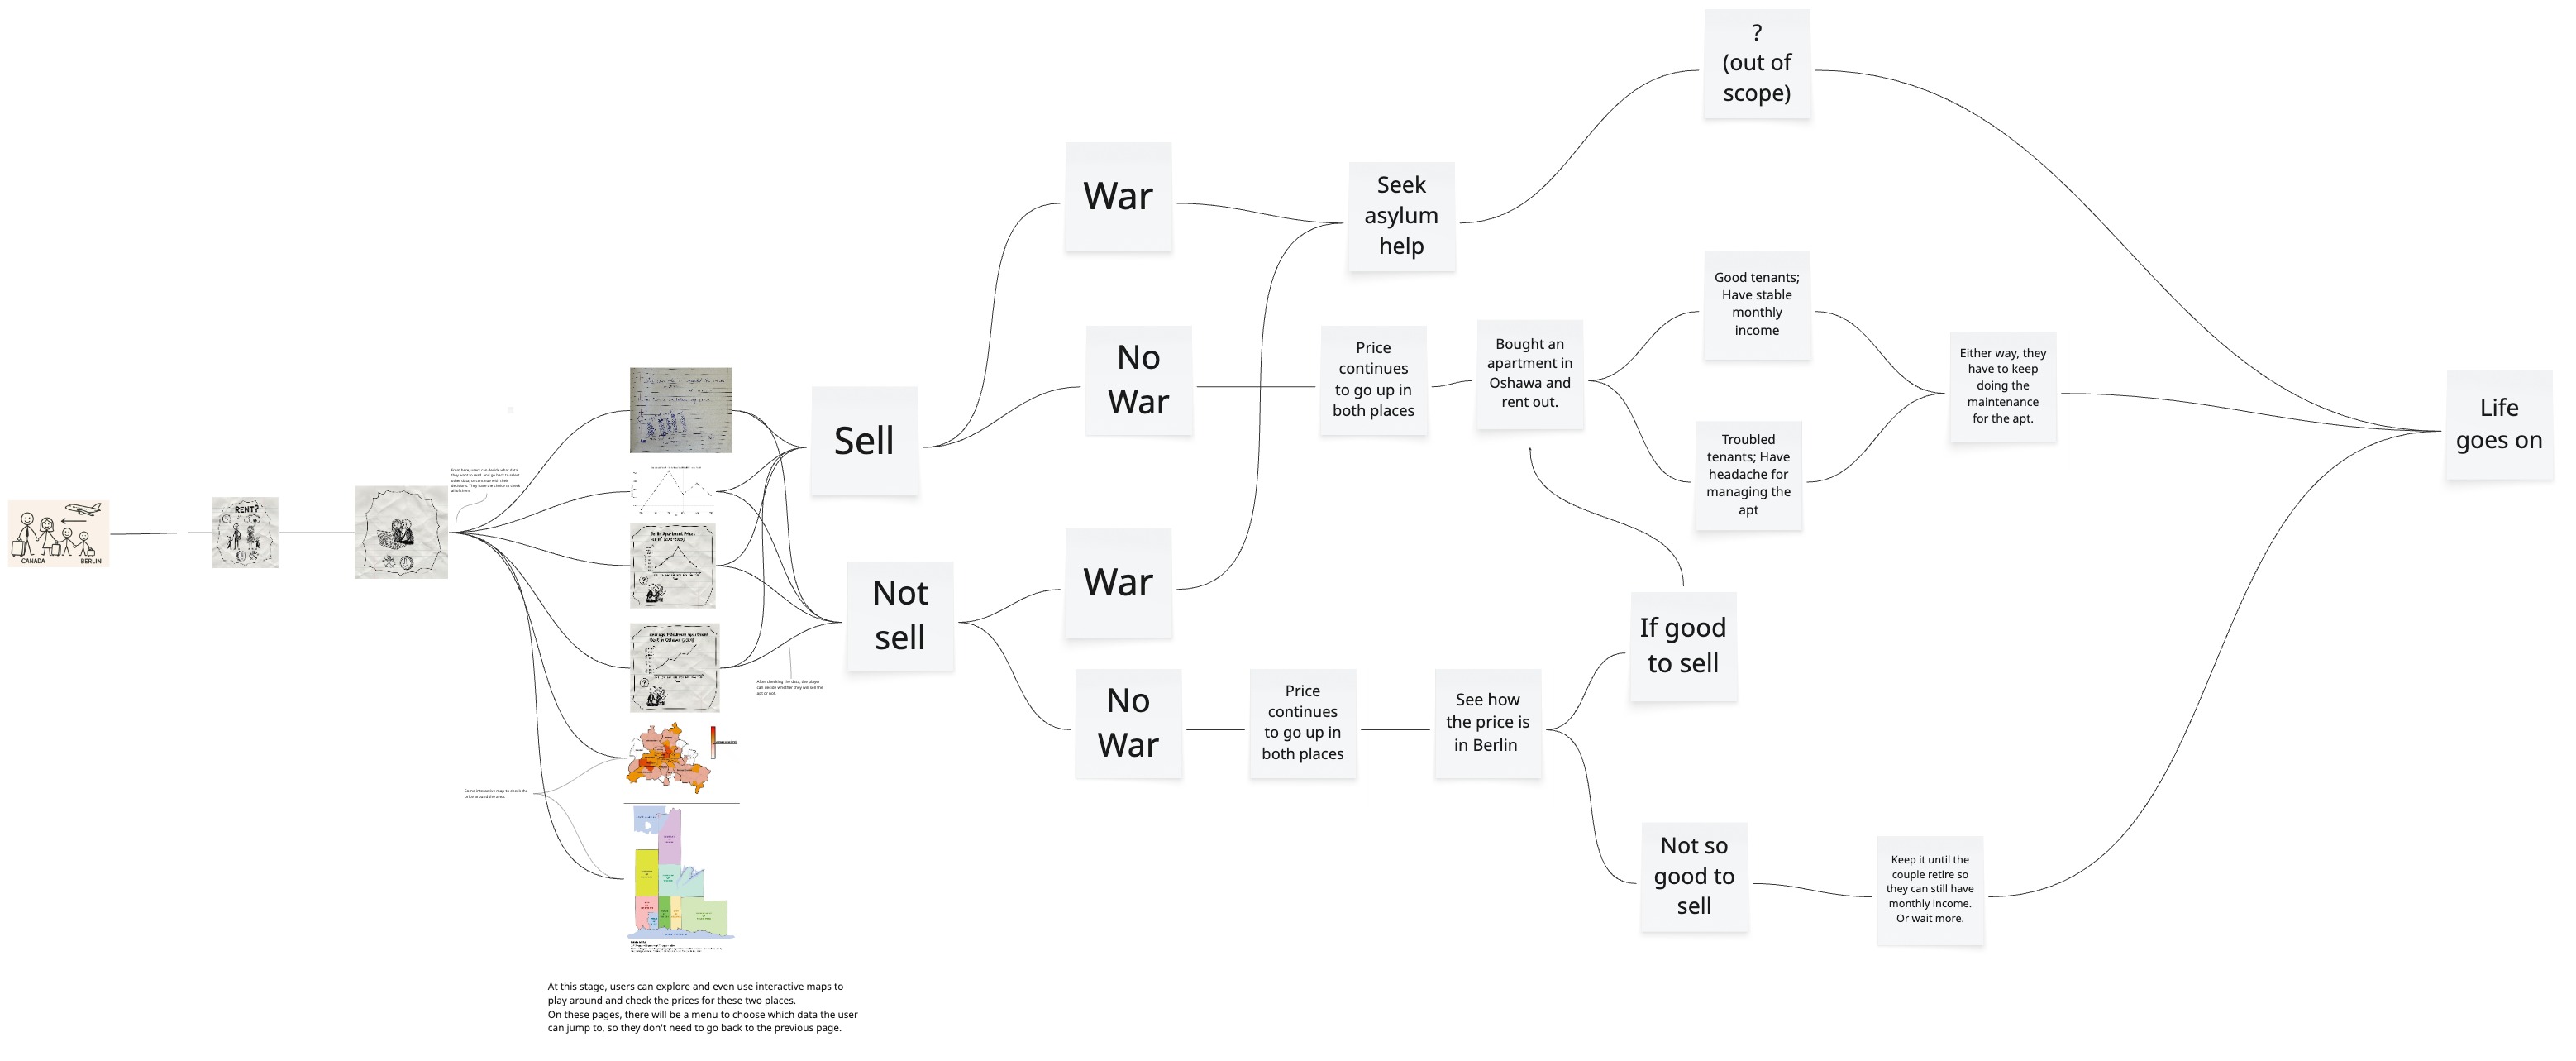
Introduction
For this assignment, I’d like to use myself as an example. Because my husband and I had just moved from Berlin to Oshawa, I am pursuing my master’s degree at Ontario Tech University. In the following, I will use Kiya and Mike to present us as a couple.
The Story
Kiya and Mike had lived in Berlin for 8 years. They bought an apartment together at the end of 2018. They set up a well-rounded life there. They have two healthy and happy children. However, there’s always a cloud on top of their heads, literally and metaphorically. Because it is always cloudy, gloomy, and grey in Berlin, it makes the family feel depressed constantly. On top of that, Kiya and Mike don’t speak German, so when Kiya had to deal with administrative work, it was always a headache. Therefore, they seek opportunities to move to an English-speaking country.
Long story short, they landed in Oshawa, Canada, and began their new life there. It was not easy at the beginning; they had to spend almost all their savings to move and secure a house and a car. Therefore, they consider selling their apartment in Berlin to have some cash in hand and ease of mind. Mike suggested selling it and buying a studio or 1-bedroom near the college to rent out, so it’s easier to maintain, and have some passive income every month. Plus, there will always be a need for rental when students start to study in the nearby college or university. Kiya started to dig into the data.
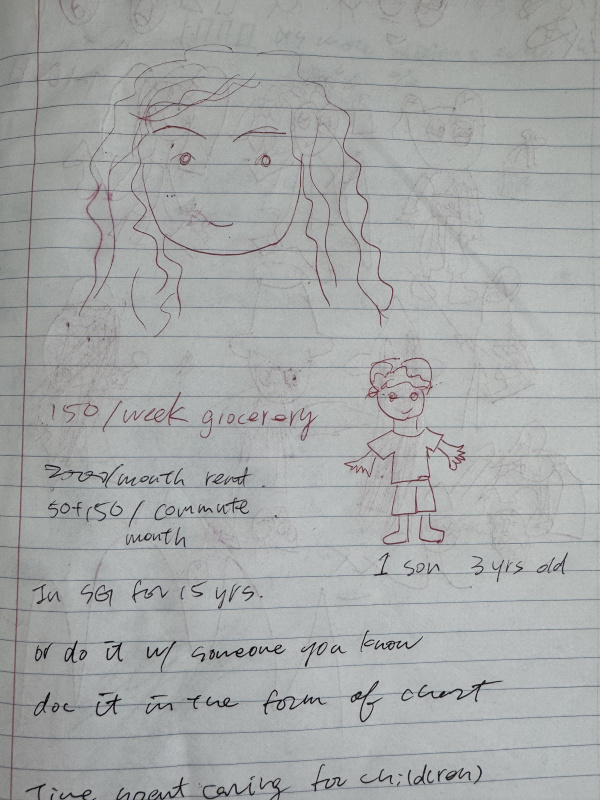
First, she asked the agent in Berlin who is managing the apartment now that how much they can sell the apartment for. Their response is that, based on the criteria provided, a rough estimate will be between 4,000EUR and 4,500EUR per sqm. They can try and start with 5,000 EUR per square meter.
Although the price has increased by around 37%. If we minus the cost (agent’s fee, notary fees, property transfer tax, etc.) when they bought the apartment, they basically only got the down payment back, so they preferred to wait until 2028 and see how it goes with the apartment. Because there’s a property gain tax in Germany that if you rent out your apartment before you sell it in 10 years, you have to pay 50% of the difference for the tax. Kiya would like to explore more data about this idea.
The Audience
I think the audience for this project is, of course, Kiya and Mike, and the mind alike, meaning people who also consider moving away from Berlin and selling their property. People who are thinking of buying in Oshawa or the Durham region can also get some insights. Or even people who are interested in comparing the lives between these two cities.
Iteration 1

Pic 1: ChatGPT helped me generate a picture of a family of 4 moving abroad. Caption: Kiya and Mike’s family of 4 is moving to Canada.
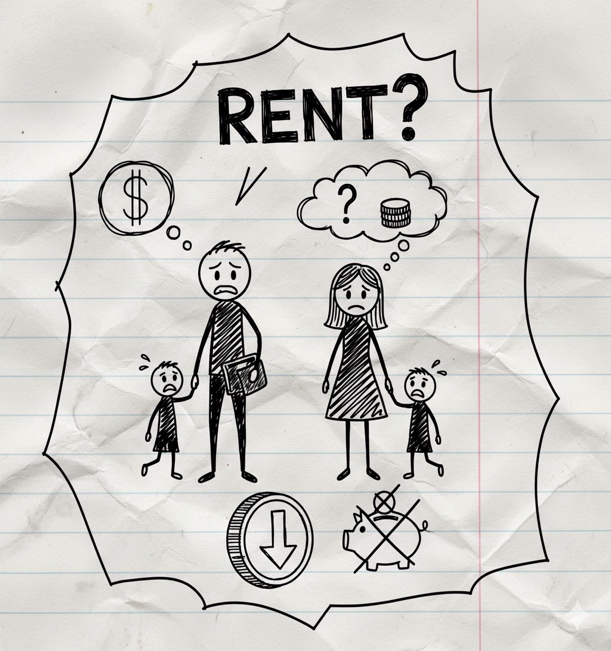
Pic 2: Soon, they found out they spent an unexpected amount of money to settle down, so they considered selling the apartment in Berlin

Pic 3: They began to check the prices in both places.
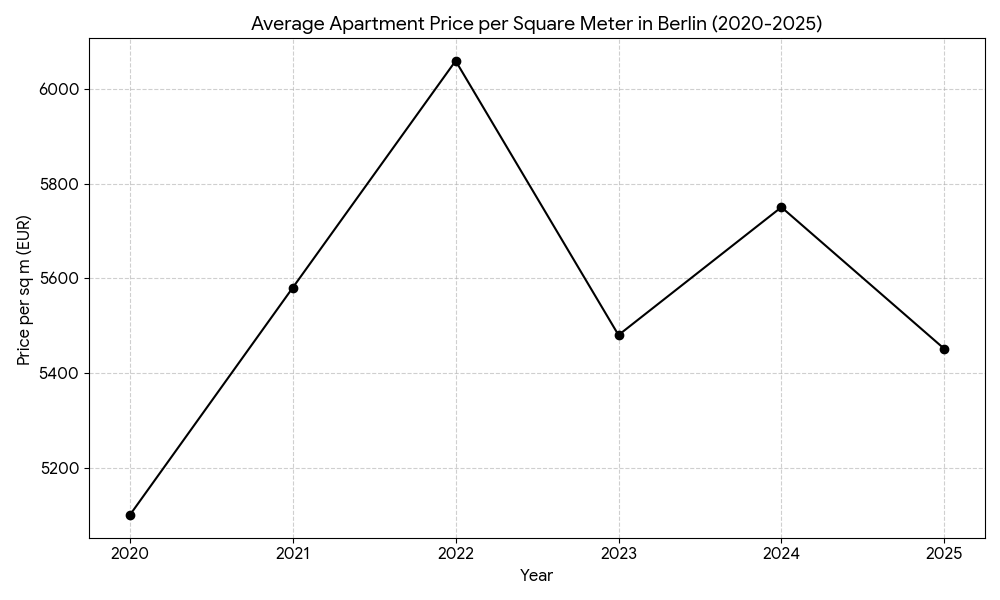
Pic 4: A graph showing what are the prices they found out. First, we show the property price.
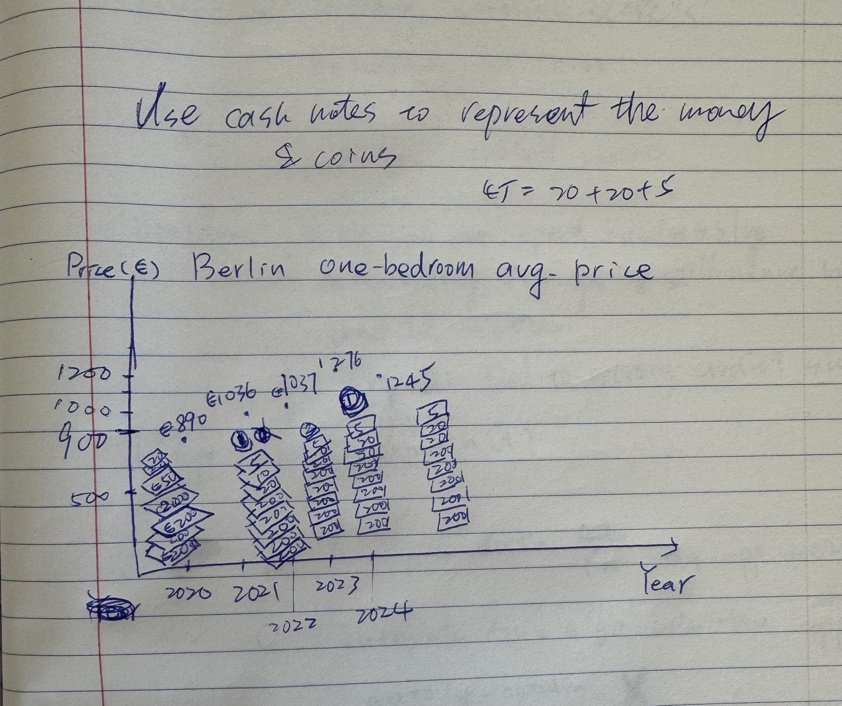
Pic 5: Show the rental price in Berlin & Oshawa. Here, I got the inspiration from Mona Chalabi to use real objects to represent data. I tried to draw stacks of cash to represent how much weight it has in these numbers.

Pic 6: Conclusion: They decided to wait until 2028, which is 10 years after they bought the apartment, and see how things go. Because maybe they have to move back, or the children will move to Berlin when they grow up.
Iteration 2
I would like to consider the potential risks here. There is a war going on in Europe, and it is unclear whether it will soon escalate across the continent. If it does, the property price might go down, so I’d like to also see the historical trend for the property that correlates to wars. So I researched a couple of analyses of the property price trend during World War 2 and even World War 1. The graph will be added after the price charts for both places. So Pic 1 – Pic 5 will be the same as iteration 1. The new data will be inserted after Pic 5:
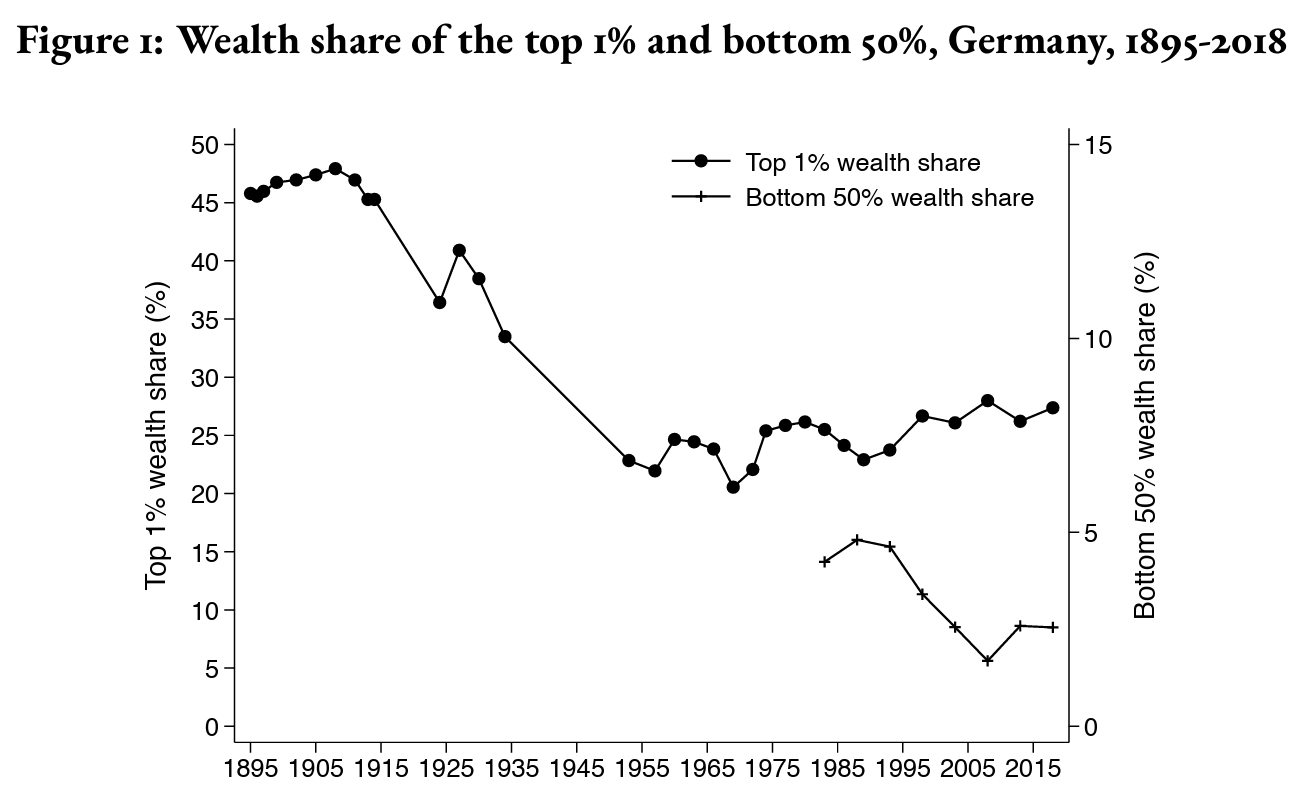
Pic 6: Historical trend for Berlin property prices during World War 2. Note: I couldn’t find an exact graph representing property prices in Berlin, but I found a graph about the wealth share in Germany. It is obvious that during WWI and WWII, people’s wealth decreased drastically.1
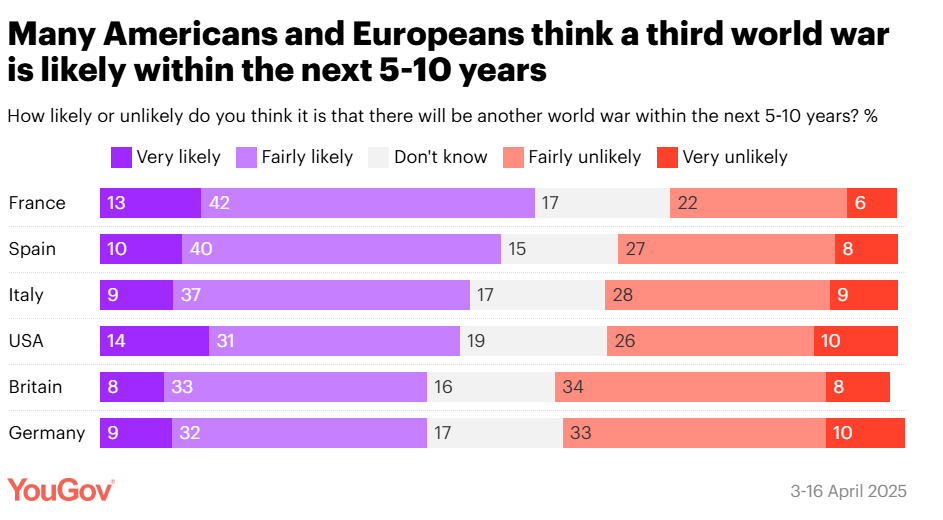
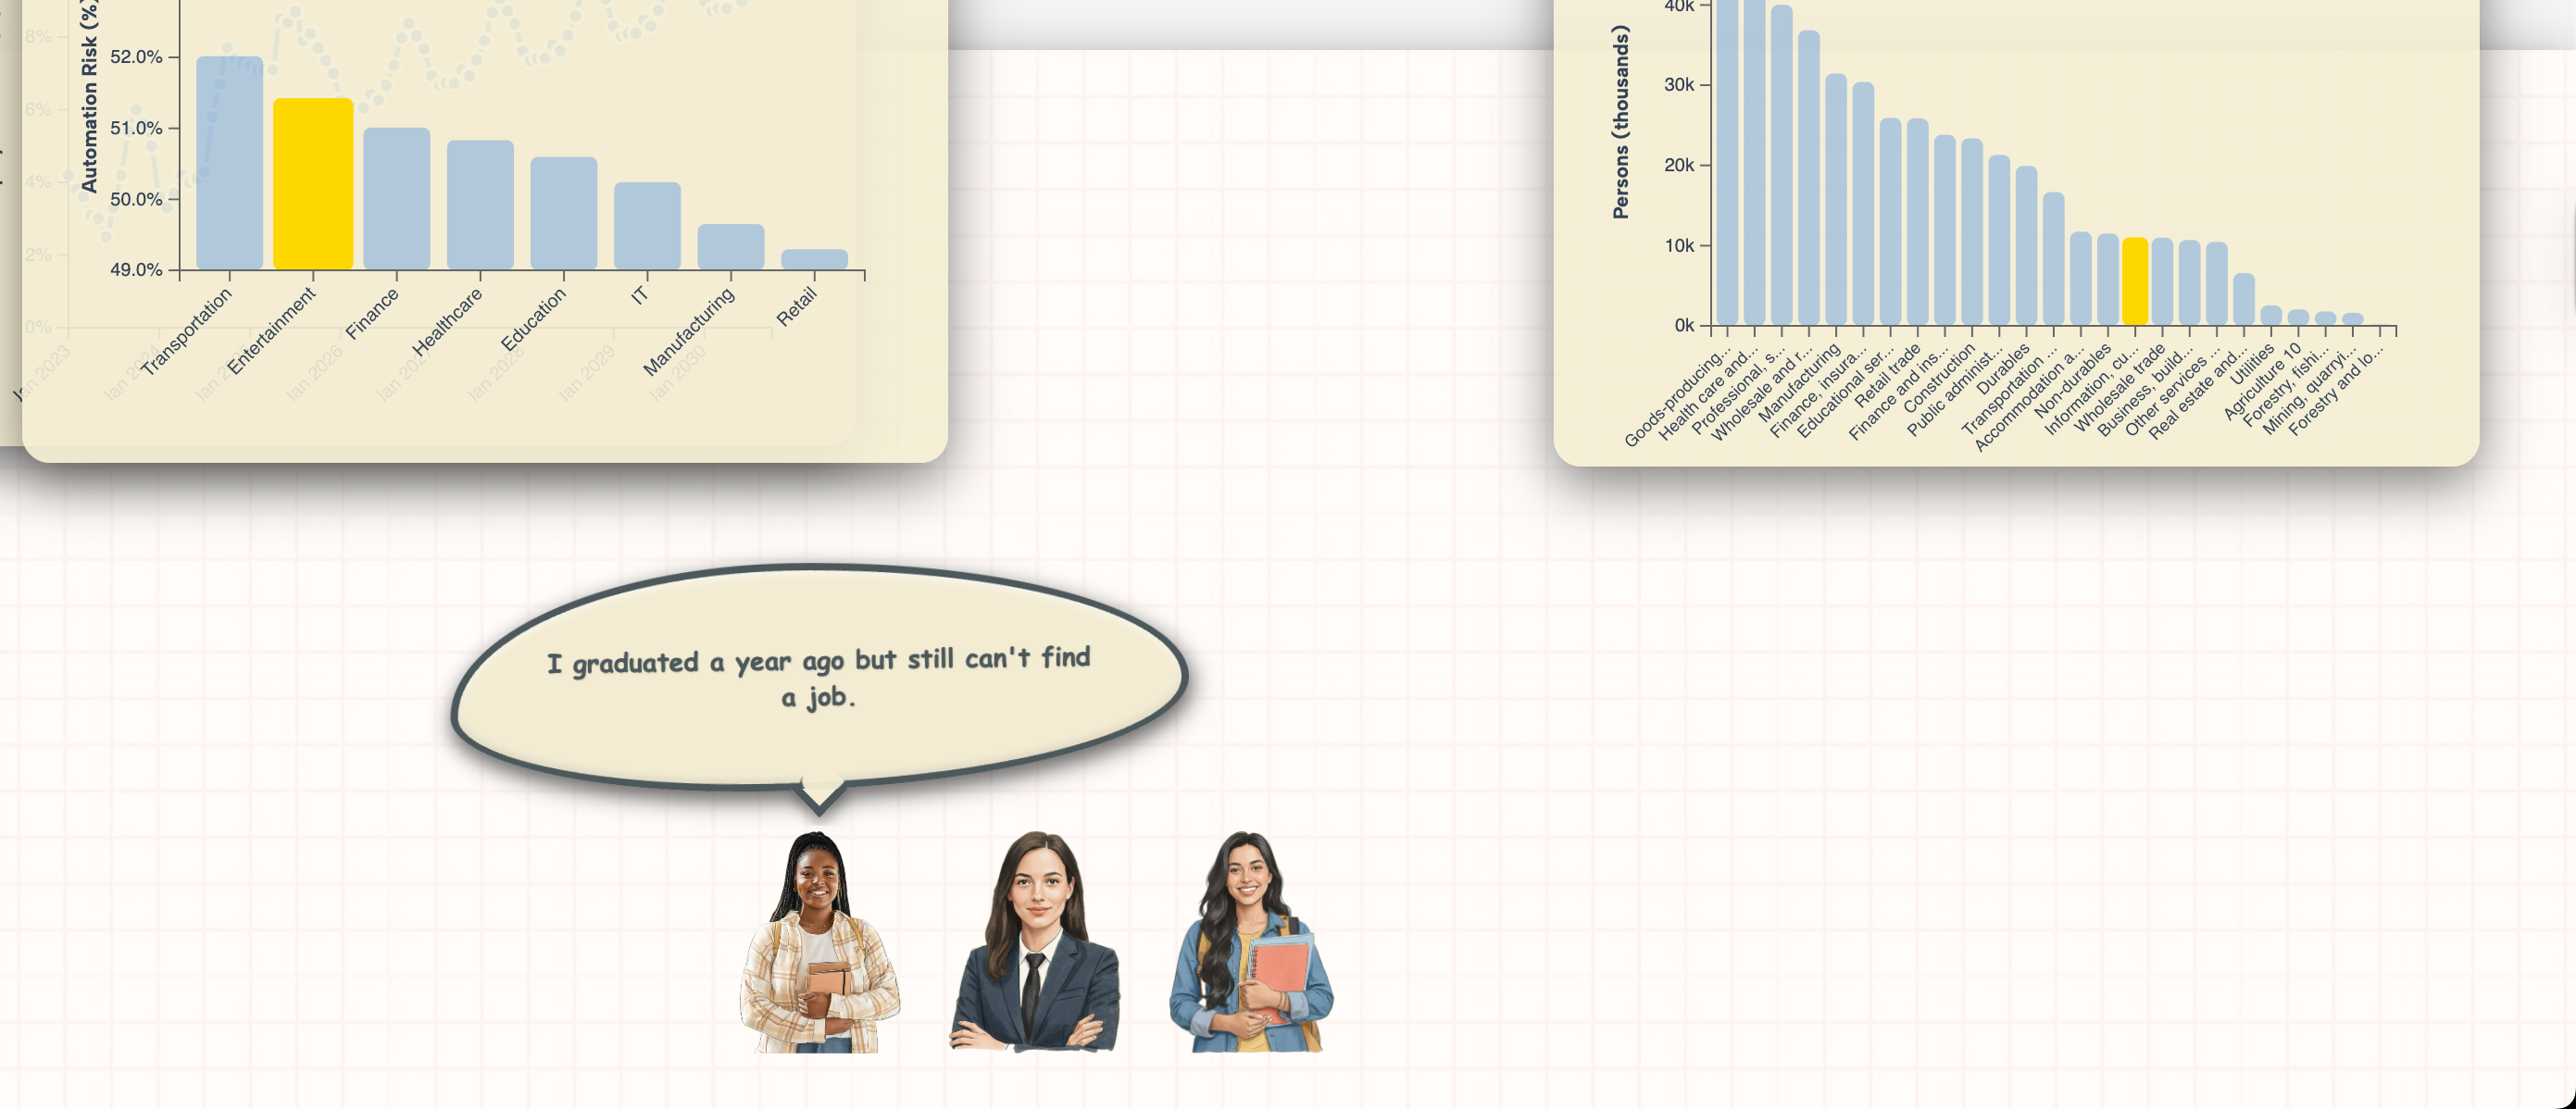
Pic 7: Analysis of whether the war will break out in Germany. For this part, it was very difficult to decide what data and what graph I wanted to use. Because most of the graph I can find are biased. At the end, I found out this pool2 was done by Global News, and found it might be more neutral to present.

Pic 8: Conclusion: most evidence shows that it won’t break out soon, so the couple could wait until 2028.
Iteration 3
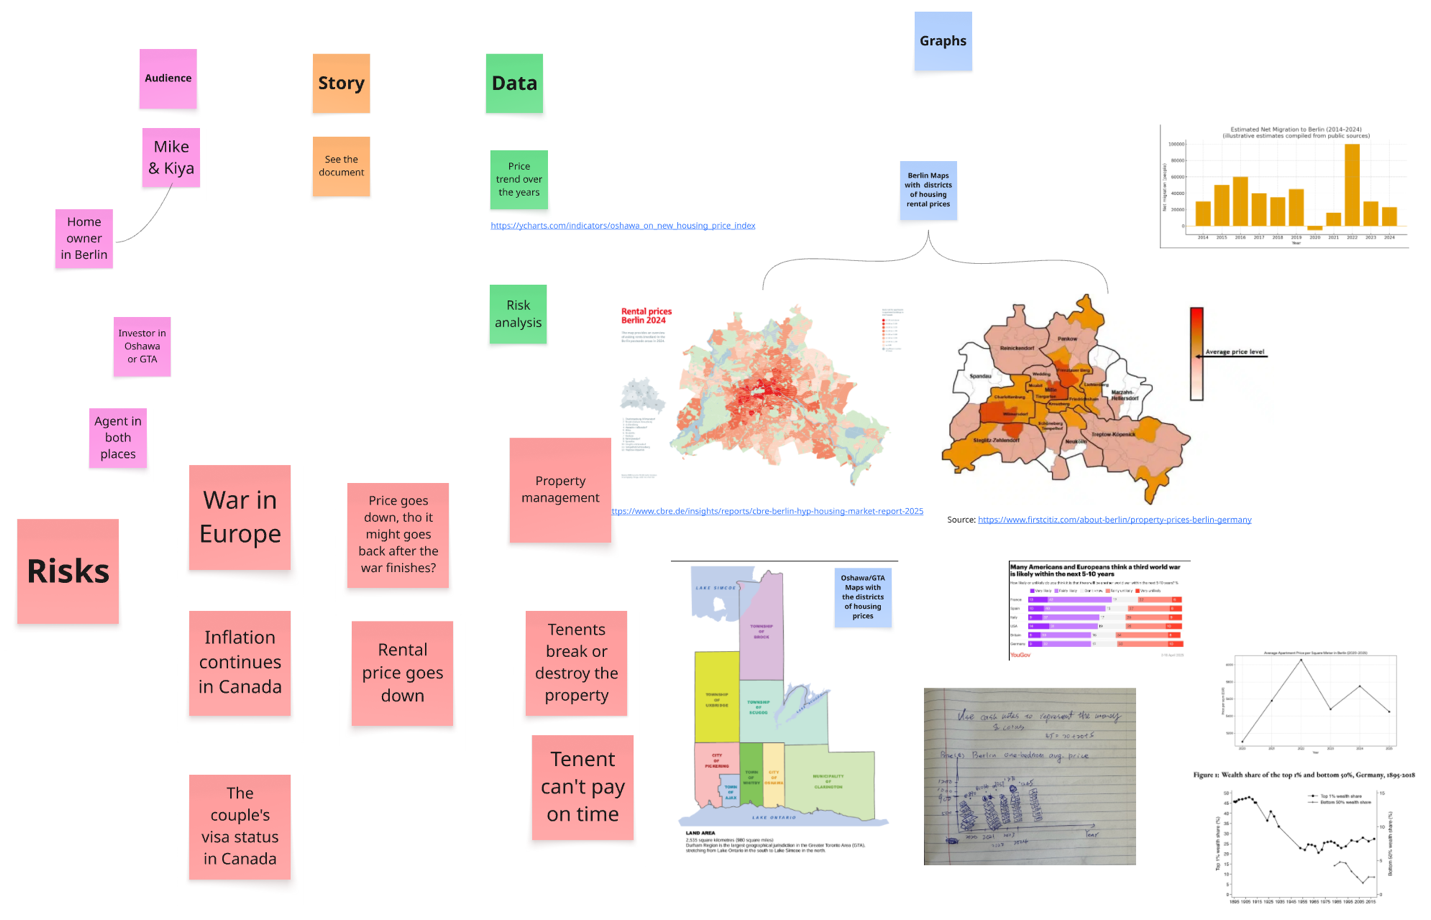
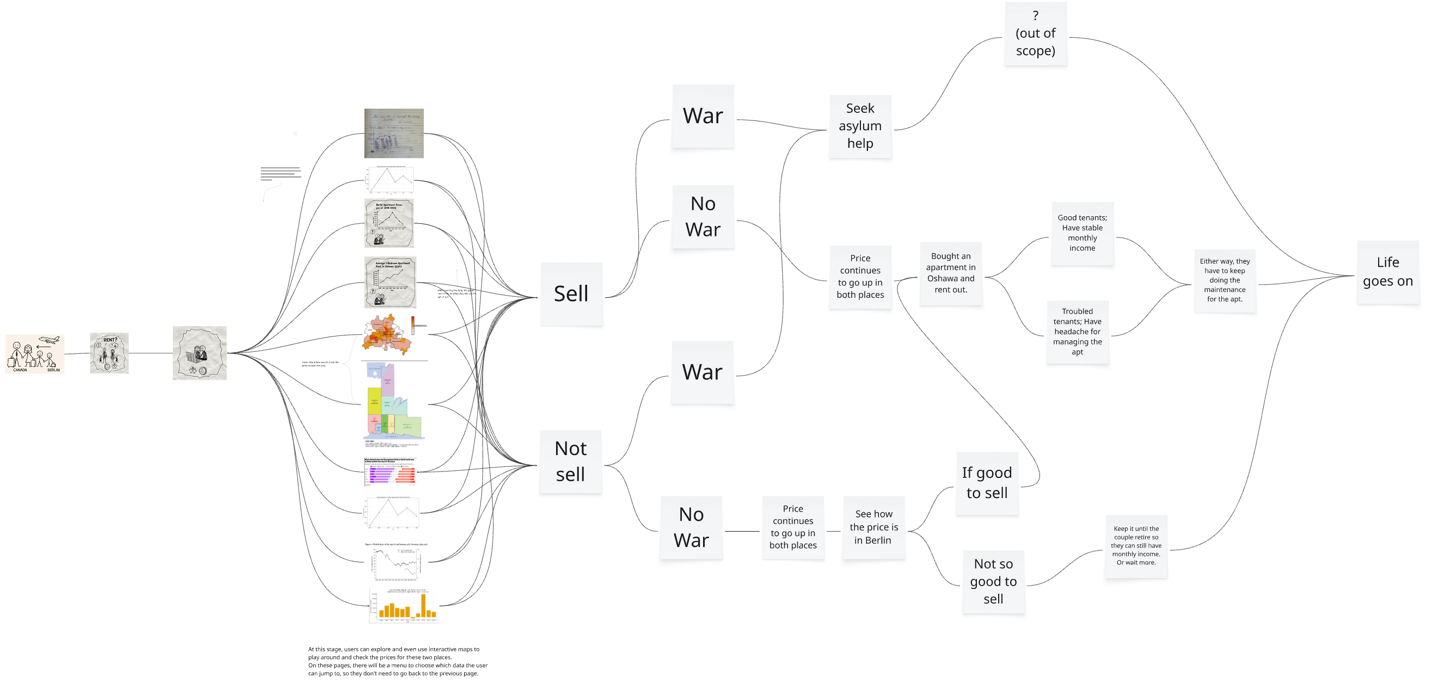
For iteration 3, I’d like to synthesize all the data and information I gathered during the research. So, I created a Miro board and dumped everything I have. And I want to show it not only with charts and graphs but also maps that help people to visualize and understand more about what story I’m trying to tell here. Then I was stuck on how to continue, so I decided to go out for a walk. I was thinking what the best way to tell this story and incorporate data. I thought about using scrollytelling method with not only scrolling down but also scrolling sideways for different scenarios. Then I remember while I was working for an interactive video company, they had these branching off trees for different scenarios, and they used them to create games, too. So I decided to use a similar approach and make the diagram in Miro. The Miro board link is here: https://miro.com/app/board/uXjVJ_V7Cx4=/?share_link_id=625196168094
I’d suggest checking the Miro board to see all the details.
All the data I gathered during my research:
And here is the final storyboard:
Conclusion
The final storyboard will be an interactive, gamified web application that brings engagement, intuitive usage, and informative data to its users. For stage 4, where all the info graphics are, the user can also go through it one by one or jump to the page they’d like to read or see. The next steps for improvement could be to unify the graphic style and make it fit for accessibility standards, so people from all backgrounds can have the chance to enjoy and play with this interactive game that is based on a true story.
Now, back to the couple, considering all the uncertainties the couple has, such as their legal status in Canada, the process for selling and buying a property between two continents, and they will probably never be able to buy an apartment at the price they bought in 2018. They decided not to sell it and wait to see how it goes.